
When salmon need underground waterways to thrive sustainably
A Tunnel Seismic Prediction campaign in Vesteralen, Norway
By Thomas Dickmann, Amberg Technologies AG
It was summer when we were heading to the north…the true North. You can't imagine a more peaceful and naturally civilized place than the Arctic Archipelago of Vesteralen in Norway. Four concrete basins are being built in the rock ground at this beautiful location, which will be used for salmon aquaculture in the future. To combine the on-land farming with the ocean, long tunnels are built to supply the salmon with clear seawater from the lower layers.
During the excavation of the south-bound outlet tunnel, after more than 1,300 meters of excavation and below the waterline, the rock quality changed from class 1 to 4B/5. The contractor urgently requested more clarification to better assess the situation in front of the tunnel face and called our geological prediction team, which offered its help on an ad hoc basis.
On the island of Andøya in the Arctic Archipelago of Vesterålen in Norway, Andfjord Salmon Group AS has developed an innovative aquaculture concept for land-based farming of Atlantic salmon based on patented flow-through technology. The concept combines the best of traditional salmon farming in the sea with the advantages of land-based farming. The facility is designed to avoid problems with salmon lice and toxic algae. It has robust barriers to prevent leakage and minimize the impact on marine life.
As part of the project, a total of approximately 4,350 metres of tunnel will be excavated. The tunnels will mainly have a cross-sectional area of 73 m2 or 90 m2 with depths of approx. 40 and 70 metres below sea level.
Based on on-site engineering geology mapping, it is assumed that the area concerned consists mainly of quartzite. According to the NGU bedrock map, however, granodiorite may be present in the intake tunnel. Experience from a test basin suggests that altered, weathered, and weak rock masses may also be present in the quartzite. However, this was not detected during the field mapping.
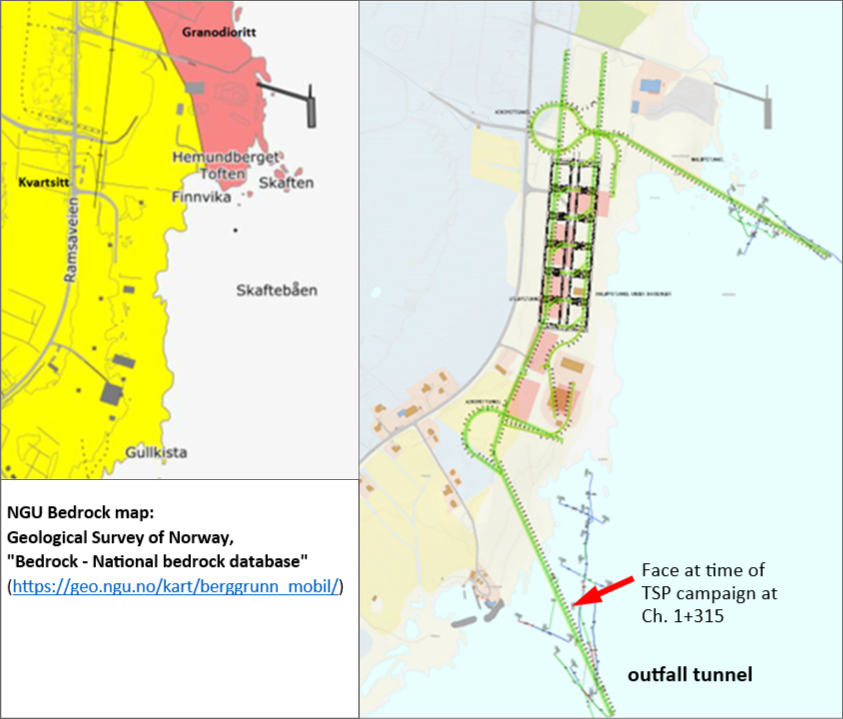
Figure 1. Left: Cut-out from NGU's bedrock map. Right: Location of the outfall tunnel, which lies in bedrock of quartzite, and face at time of TSP campaign.
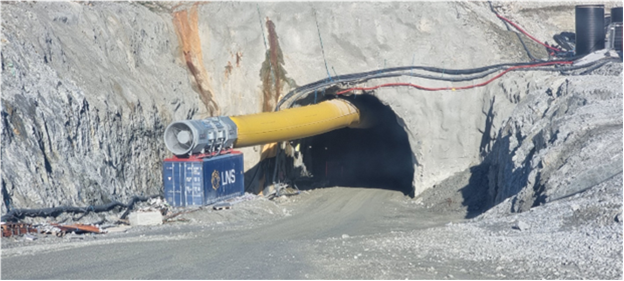
Figure 2. Tunnel portal of outfall tunnel.
In mid-August, the Tunnel Seismic Prediction campaign was carried out. 24 shot holes with a 1.5 metre spacing were aligned along the left tunnel wall just behind the face. Each two seismic 3-component receivers with wireless transceivers had been deployed left and right side, whereby the sensors are firmly coupled to the rock at a depth of 1.5 m in each borehole (Figure 3). The multi-shot recording method implemented in TSP enables the recording of shot groups with five shots in a row at short intervals of just 1 second. Using this method, the seismic operation was completed within 1.5 hours.
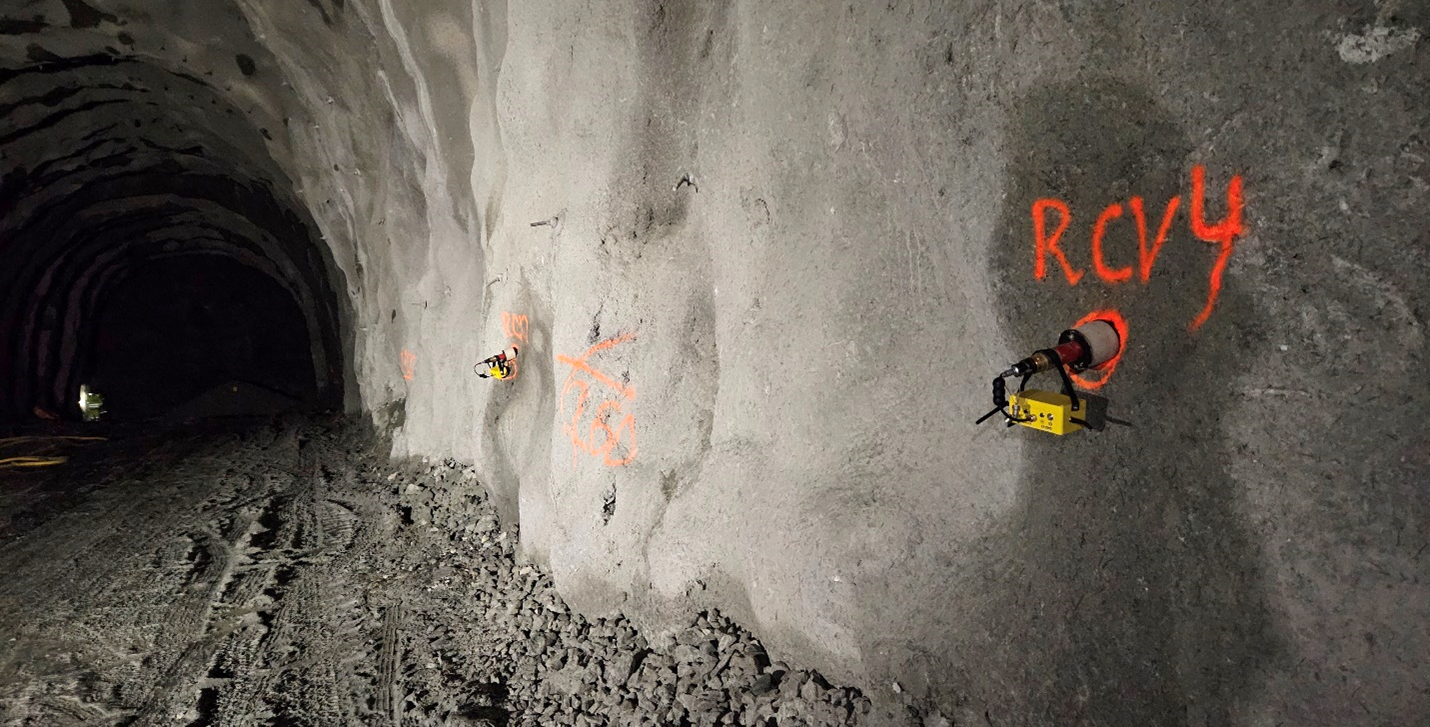
Figure 3. Two of four receivers and wireless transceivers are seen, which had been deployed into the rock mass of the tunnel's side wall.
Along the seismic layout, changes in the rock mass condition were observed due to the presence of highly fractured quartzite with further decreased velocities. The reference values for the P-wave (Vp) and S-wave velocity (Vs) distribution are at 4,450 m/s and 2,570 m/s, respectively. These wave velocities represent the ground with partially existing fractures. Figure 4 depicts the plan sections through the seismic axis extracted from the 3D-model of the P-wave and S-wave velocities. The model is centred 0.25 m below the axis and spans from Reference point at TM 1+254 to TM 1+425. Fluctuations in the velocity values can be seen in front of the face, and at velocities of P- and S-waves below the reference values of 4,450 m/s and 2,570 m/s, respectively, zones with increased fracture formation are to be expected.
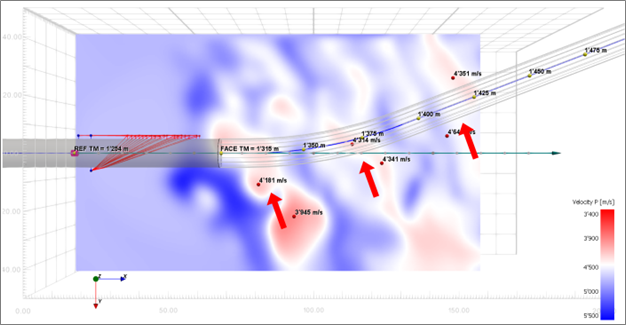
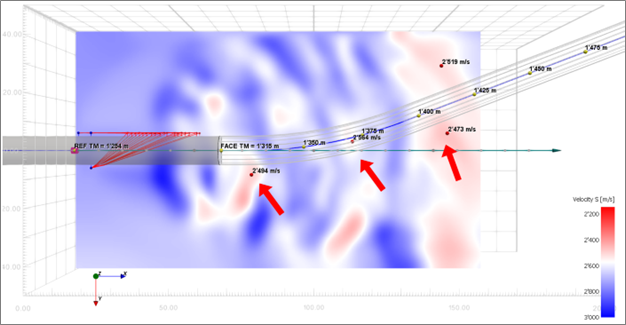
Figure 4. Plan views of the 3D P-wave (top) and S-wave (bottom) velocity model along the seismic axis including the tunnel model with the location of the shot holes (red dots) and the receivers (blue dots). The main zones of reduced velocities are marked by red arrows.
Figure 5 shows a plan view of the Poisson’s ratio. The reference value along the seismic layout is at 0.25. The zones from TM 1+345 to 1+355, from TM 1+380 to 1+388, and from TM 1+395 to the end of the model show values higher than 0.28. They indicate an increase of fracturing and most probably relate to water bearing.
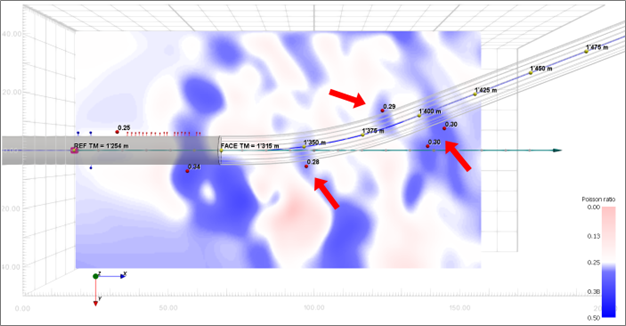
Figure 5. Plan view of Poisson’s ratio. Zones with increased values > 0.28 are marked by red arrows and indicate water bearing.
After the TSP measurement, the contractor drilled 30 m boreholes from the tunnel face to check the seismic prediction of the nearby fault zone. A representative borehole is shown in Figure 6 and is compared with the P-wave velocity. The borehole shows a strong fluctuation in the calculated hardness after about 10 meters. This is due to increased fracturing corresponding to the low velocity seismic zones.
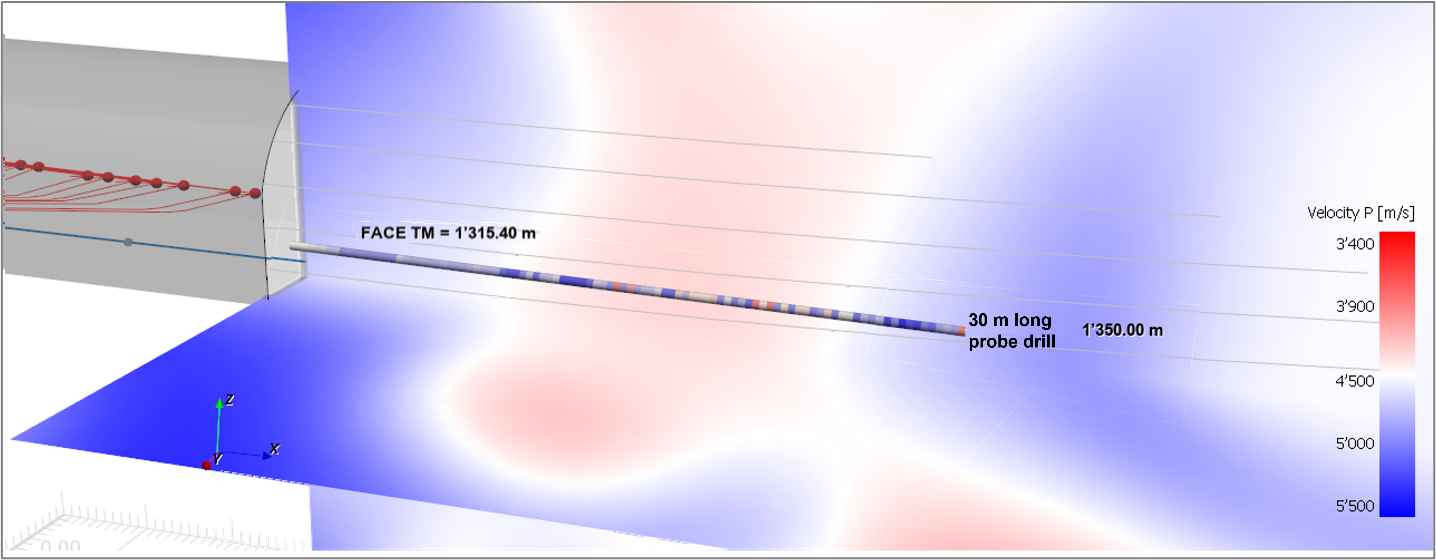
Figure 6. Plan and longitudinal sections of the 3D P-wave velocity distribution near a 30 m long probe drill after the TSP campaign. The probe drill's colour setting represents calculated hardness of the rock mass. From about 10 m, a strong fluctuation of the hardness also shows a higher fracturing, which corresponds to the seismic prognosis (red area).